
Give Us 30 Days & We'll Match You With a High Performing Airbnb - Guaranteed
With years of experience and a perfected formula, we extract only the most valuable insights from the best data, ensuring we find short-term properties that Produce The Highest Returns.
All The Ways We Can Help You
Free Courses, services and trainings, to help you Maximize Your Earnings from Airbnb...


From Data to Dollars:
Real Success Stories from Thriving Investors
From first-time investors to seasoned pros, see how our commitment to comprehensive data analysis led to unparalleled investment victories.
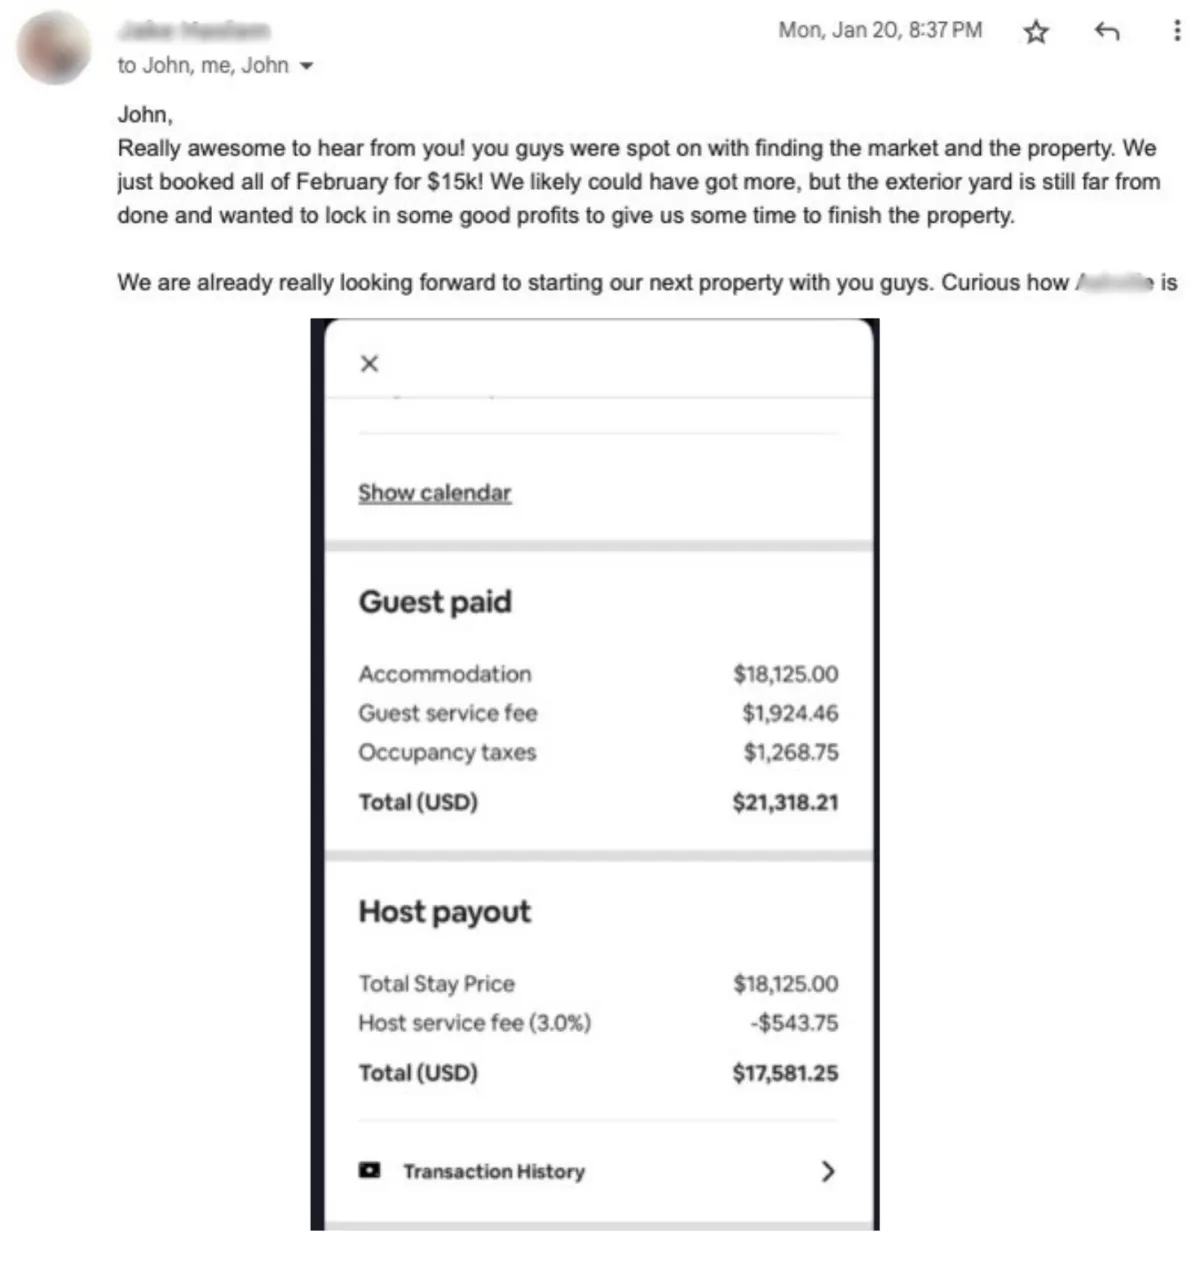
"From zero real estate experience to a thriving short-term rental business—Allison locked in $120K in revenue her first year and is now expanding with STR Search again. Proof that the right team can turn analysis paralysis into profitable action!"
Allison
"Thanks to John's expert guidance, I made my first real estate and Airbnb investment a massive success, with consistent positive cash flow and an exceptional return on investment!"
Arul
"John's training gave me the confidence to secure a loan on the spot and scale from one STR to three—his approach is a total game-changer!"
Philip

FAQ
Isn't Airbnb too Saturated?
On the contrary, the perceived saturation of 2024's Airbnb market opens doors for investors. With the right data at your disposal, you can uncover hidden markets and investment opportunities that others overlook, positioning you perfectly to excel where others see obstacles.
How much money do I need?
An ideal investment of at least $175,000 is recommended to launch an Airbnb venture effectively. With our extensive experience of over 200+ successful setups, we possess a deep understanding of the necessary investment. It's important to be cautious of advice suggesting lower costs, as it often implies a compromise in quality or an expectation for you to undertake significant groundwork.
Do I need a Realtor?
While realtors are crucial for understanding local market dynamics and finding properties, their expertise typically doesn't cover the financial intricacies of forecasting cash flow for short-term rentals. This requires specific analysis and tools beyond traditional real estate knowledge.
Cool, but why you?
I do this for the love. And it just happens to help a lot of people. It works. Not being cocky, but it does. People praise you in public for what you practice in private.
We're Trusted By the Best in the Business
STR Search and the Bianchi Method has gained a reputation among industry leaders as being the front runner in consistently matching people with profitable properties.

Avery Carl
- Founder of The Short Term Shop

Rob Abasolo
- Founder of Host Camp and Youtube Channel Robuilt

Sief Khafagi
- Founder of Techvestor

Jeremy Werden
- Founder of BNBCalc

Dr. Rachel Gainsbrugh
- Founder Short Term Gems
Avery Carl
- Founder of The Short Term Shop
Rob Abasolo
- Founder of Host Camp and Youtube Channel Robuilt
Sief Khafagi
- Founder of Techvestor
Jeremy Werden
- Founder of BNBCalc
Dr. Rachel Gainsbrugh
- Founder Short Term Gems
Put your money to work & lower your tax bill with a high performing Airbnb
Years of passionate analysis have equipped us with the expertise to help you make a data backed decision. Our dedication stems from a genuine desire to help you thrive. Trust us to steer you away from the pitfalls of bad data and towards the rewards of wise property investment.
Disclaimer: STR Search strives to provide valuable insights and strategies for optimizing short-term rental (STR) investments. While we aim to help clients put their money to work and potentially lower their tax bills, we cannot guarantee the financial performance of any property or investment. Real estate markets are inherently unpredictable, and individual results may vary based on factors such as location, market conditions, management practices, and other variables outside our control. Additionally, lowering your tax bill through STR investments may require you to meet specific qualifications outlined in the IRS Passive Activity Loss Rules and the Short-Term Rental Exception. We encourage all clients to consult with a qualified tax professional or financial advisor to determine their eligibility for this tax benefit and to understand the implications of their investment decisions. By engaging with our services, you acknowledge that all investments carry risk, and past performance is not indicative of future results. STR Search is not a tax, financial, or legal advisory firm, and any information provided should not be considered as such.